
Custom dashboards
The default dashboard
When you log in, Dashboard in the sidebar shows the default dashboard. It contains four kinds of content.
- Announcements from your account, if you defined any under
Account › News - The AI summary card with a narrative of your analytics for the last 12 months, written by the AI assistant, and an Ask AI about this data button
- Four stat tiles named Active Registrations, Deactivated Registrations, Passes Created Yesterday and Passes Created This Month
- Two line charts named Created Passes and
Active Passes
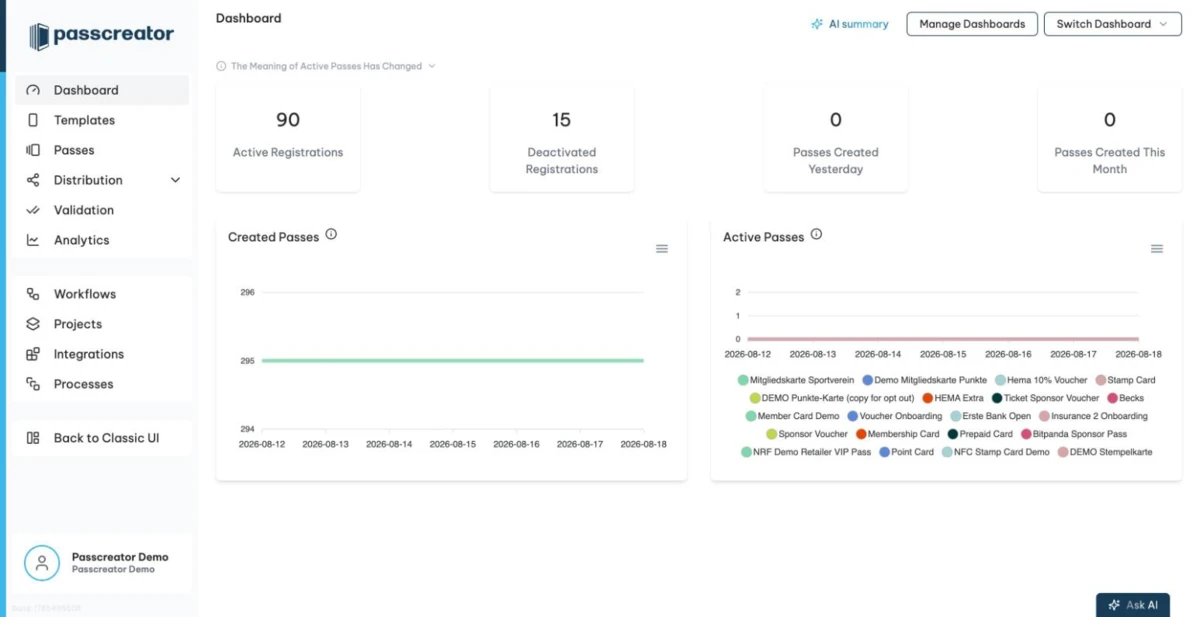
At the top of the dashboard you'll find a Manage Dashboards button and a Switch Dashboard dropdown. The dropdown lists the Default Dashboard, your own dashboards and a Shared Dashboards group with dashboards other users have shared with you.
Creating a dashboard
- Go to Dashboard in the sidebar and click Manage Dashboards.
- Create a new dashboard and enter a Dashboard Name.
- Choose the type. A Personal dashboard is visible only to you. A Shared dashboard is visible to others, either to everyone in your account or to specific users.
- If you want, enable Show in Menu to add the dashboard to the navigation, and Default dashboard to open it automatically after you log in.
- Save. Passcreator takes you straight into your new dashboard in edit mode.
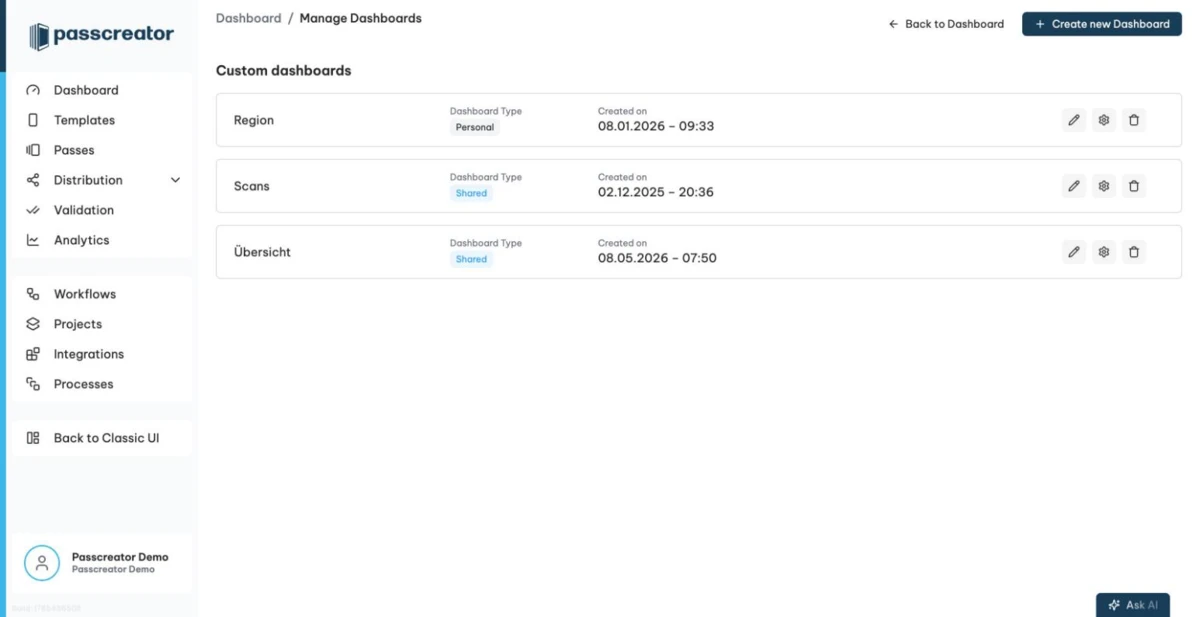
You edit or delete dashboards from the same management page. Before deleting, Passcreator asks you to confirm.
Editing the layout
Use the Edit Mode button on a dashboard to toggle editing. The layout consists of rows.
- Click Add Row and choose how many columns the row has, from 1 Column up to 4 Columns.
- Click Add Widget in a column and pick a widget type. The table below lists all types.
- Rearrange with Move Up, Move Down and Move Widget. Use Edit Widget to change the configuration of a widget.
- Remove widgets with Remove Widget or whole rows with Remove Row. Removing a row deletes all its widgets, so Passcreator asks you to confirm.
- When you're done, turn Edit Mode off.
Widget types
| Widget | What it shows | Configuration |
|---|---|---|
| Number Tile | The current pass count of a saved segment as a big number. | Display Name, Segment and Auto Reload with the options Never, 60 Seconds, 5 Minutes, 10 Minutes, 20 Minutes and 30 Minutes |
| Button | A shortcut button that links anywhere, inside Passcreator or to an external site. | Label, Target URL, Open in new window |
| Analytics | A chart that aggregates the passes of a segment by one of its properties. | Title, Segment, Aggregate Field, an optional Sub-Aggregate Field, Timeframe from Last 7 Days to Last Year, and Interval with Day, Week, Month, Quarter or Year |
Active Passes History | The history of the Active Passes count across your whole account. | The variant Daily, End of Month or Peak Month |
| Scans per Device | A live view of Smart Scan app scans per scanning device within a rolling time window. | Title, Timeframe (Minutes), App Configuration |
| Template Details | The Passes stats for one template, its upcoming Scheduled Tasks and a View Details link. | Template |
The aggregation fields of the Analytics widget come from the properties available for segmentation. Passcreator does not offer internal system fields like serial numbers there. Widgets with auto reload show the countdown Reloading in … seconds and a Reload now action.
Example of a live scanning dashboard
For an event where staff scan tickets with the Smart Scan app, a dedicated scanning dashboard gives you a live overview at the entrance.
- Create a dashboard named, for example,
Scanning Dashboardand enable Show in Menu. - Add a row with two columns.
- In the first column, add a Scans per Device widget titled "Scans last 5 minutes". Set
Timeframe (Minutes)to5and select the App Configuration of your event. - In the second column, add another Scans per Device widget titled "Scans last 30 minutes" with a timeframe of
30minutes. - If you want, add a Number Tile based on a segment of scanned or installed passes, with Auto Reload set to 60 Seconds. Total attendance then updates on its own.
- Turn off Edit Mode.
If nobody scanned anything in the selected window, the widget shows No scans recorded in the selected time frame.
Next step
Continue withAnalyticsChecked 2026-08-20 · Documentation